
Holographic print detection is an essential task in applications requiring automatic validation of government-issued ids, banknotes, credit cards and other printed documents from a video stream. Today we’ll discuss how to approach this problem with Python and OpenCV.
Unique features of holographic print
Human can instantly recognize a holographic print by two main characteristics:
- highly reflective
- color changes within a wide range depending on relative position of the light source
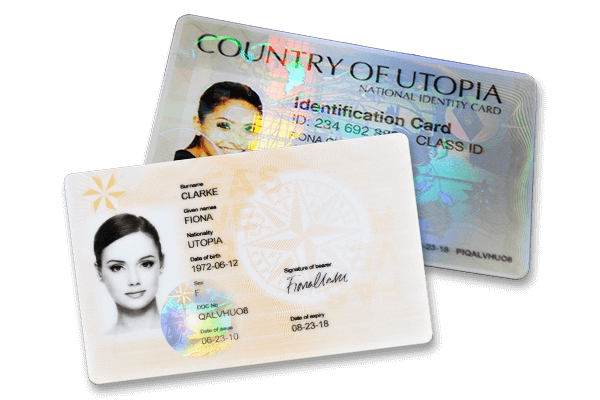
Some prints, like logos on credit cards, may have more advanced security features when holographic print incorporates specific sequence of images which is ‘played’ when you rotate it against the light source. In this article, we will focus on just two main characteristics above.
Sample data
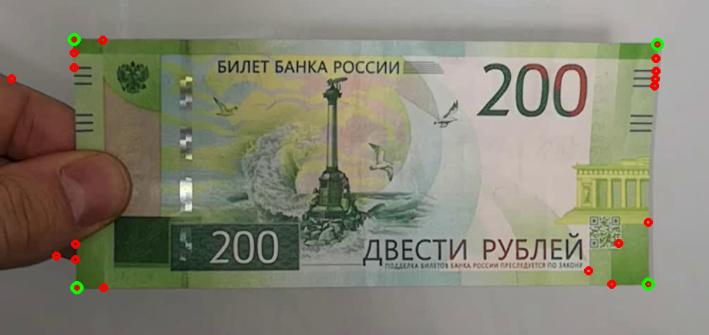
First, we’ll need to collect the data for analysis – a sequence of frames capturing the holographic print from different angles under directional light source. The optimal way to achieve this is to record a video with a smartphone with torch turned on, like this:

Now, as we have the data to experiment, what’s our plan?
- Perform segmentation – accurately detect the zone of interest on each frame
- Unwarp and stack zone of interest pixels in a way ensuring coordinates match between frames
- Analyze resulting data structure to find coordinates of hologram’s pixels
- Display results
Image segmentation
Because the object which have holographic print on it (or a camera) will be moving, we’ll need to detect the initial position and track it throughout the frame sequence. In this case, a banknote has a rectangular shape. Let’s start by identifying the biggest rectangle on the image.
# convert to grayscale
gray = cv2.cvtColor(img, cv2.COLOR_BGR2GRAY)
# get corners
features = cv2.goodFeaturesToTrack(gray, 500, 0.01, 10)
corners = features.squeeze()
# get some number of corners closest to corresponding frame corners
corner_candidates = list(map(lambda p: closest(corners, p[0], p[1], HoloDetector.NUM_CANDIDATES),
                             ((0, 0), (0, gray.shape[0]), (gray.shape[1], gray.shape[0]), (gray.shape[1], 0))))
# check for rectangularity and get a maximum area rectangle
combs = itertools.product(*corner_candidates)
max_rect = None
max_area = 0
for c1, c2, c3, c4 in combs:
    # calculate angles using
    angles = [angle(c1 - c2, c3 - c2),
              angle(c2 - c3, c4 - c3),
              angle(c1 - c4, c3 - c4)]
    if np.allclose(angles, np.pi / 2, rtol=0.05):
        area = la.norm(c2 - c1) * la.norm(c3 - c2)
        if area > max_area:
            max_rect = [c1, c2, c3, c4]
            max_area = area
Here, goodFeaturesToTrack function is used to get strong corners from the image, then maximum rectangle of a proper orientation is estimated.
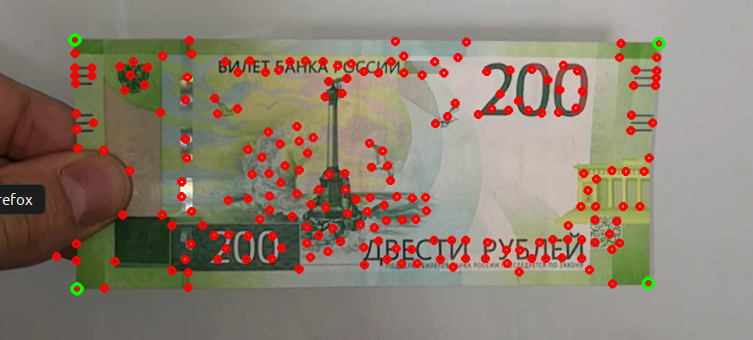
Tracking the movement
An obvious way to track the movement would be to detect corners in a similar way on all consecutive frames, however, this method is not robust to changes in the background and severe rotations of the object. Instead, we will detect initial features inside the rectangle, and estimate their new positions on consecutive frames using optical flow algorithm
# get start keypoints inside rectangle
features = cv2.goodFeaturesToTrack(gray, 1000, 0.01, 19)
rect_contour = np.array(rect).astype(np.int32)
# take only points inside rectangle area
last_features = np.array(list(filter(lambda p: cv2.pointPolygonTest(rect_contour, tuple(p.squeeze()), False), features)))
Note: we could skip rectangle detection altogether and detect keypoints on full image, but it’s unrealistic to have such a convenient neutral background in a real-world scenario.
Now it’s possible to look for same keypoints on every next frame using a function which implements Lucas-Kanade method. Additional trick here is to filter out unstable keypoints by running an algorithm forward and backwards, and then cross-checking result with known initial keypoints.
def checkedTrace(img0, img1, p0, back_threshold=1.0):
    p1, _st, _err = cv2.calcOpticalFlowPyrLK(img0, img1, p0, None, lk_params)
    p0r, _st, _err = cv2.calcOpticalFlowPyrLK(img1, img0, p1, None, lk_params)
    d = abs(p0 - p0r).reshape(-1, 2).max(-1)
    status = d < back_threshold
    return p1, status

# calculate optical flow with cross check
features, status = HoloDetector.checkedTrace(last_gray, gray, last_features)
# filter only cross-checked features
last_features = last_features[status]
features = features[status]
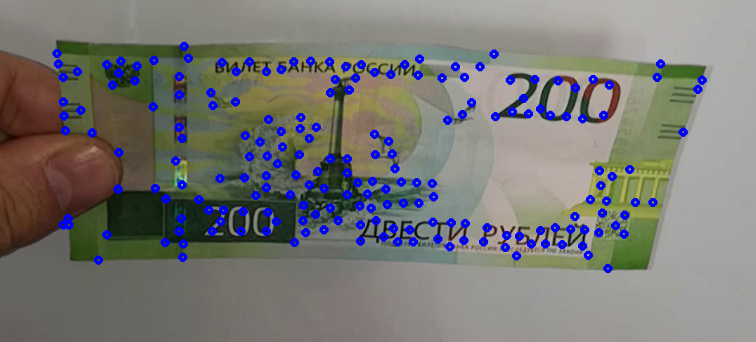
To map pixel coordinates of a given frame to source frame’s coordinates, we’ll need to estimate a transformation matrix with findHomography function, which takes two lists of source and destination keypoints and returns a transformation matrix.
# estimate transformation matrix
m, mask = cv2.findHomography(features, last_features, cv2.RANSAC, 10.0)
# unwarp image into original image coordinates
unwarped = img.copy()
unwarped = cv2.warpPerspective(unwarped, m, img.shape[:2][::-1], flags=cv2.INTER_LINEAR)
Here’s how the video looks after unwarping. Not perfectly aligned, because banknote have some curvature of itself, but much better!
Detecting a hologram
Previous processing steps allowed us to get a data structure like this:

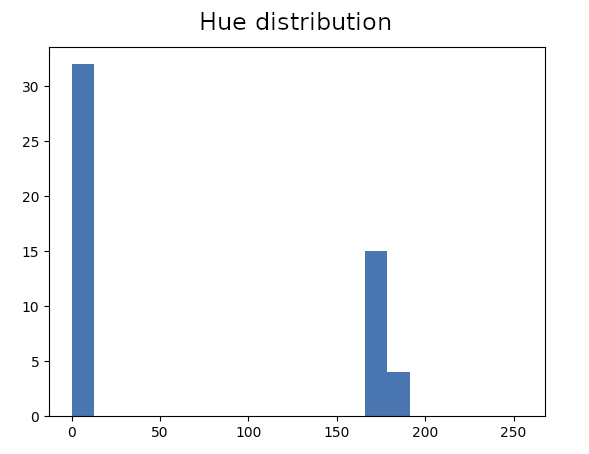
Where z-axis represents the number of frame in the sequence. Let’s create histograms of individual pixel values in HSV color space.
HSV space
As you can see, Hue value have much wider range for pixels of the hologram. Let’s filter pixels based on that and highlight the ones with 5% – 95% percentile range above a certain threshold. Let’s also cutoff dark pixels with too low S and V values.
# quantile range for holo pixels on H component is expected to be much wider
qr = np.quantile(holo_stack[:, :, 0, :], q=0.95, axis=2) - np.quantile(holo_stack[:, :, 0, :], q=0.05, axis=2)
# Saturation and Value thresholds because on lower values H component may be unstable
ms = np.mean(holo_stack[:, :, 1, :], axis=2)
mv = np.mean(holo_stack[:, :, 2, :], axis=2)
filtered_points = []
holo_points = np.where((ms > 50) & (mv > 50) & (qr > HoloDetector.HOLO_THRESHOLD))
holo_mask[tuple(zip(*filtered_points))] = (0, 255, 0)
Success! The holograms most visible on the video are highlighted, but we have some false positives. What’s wrong with these pixels?
That is the result of inaccurate unwarping, pixels laying on strong edges have two distinct values. The difference with hologram pixels is that they are not taking all the values in between of these histogram peaks. In other words, their distribution is less uniform. We can use Chi-squared test to check for uniformity and filter these pixels out:
filtered_points = []
# filter detected pixels by uniformity of their distribution, holo points are taking multiple colors,
# while misaligned edge pixels will have only few different values
for y, x in zip(*holo_points):
    freq = np.histogram(self.holo_stack[y, x, 0, :], bins=20, range=(0, 255))[0]
    # checks for uniformity without expected frequencies parameter
    chi, _ = scipy.stats.chisquare(freq)
    if chi < HoloDetector.UNIFORMITY_THRESHOLD:
        filtered_points.append((y, x))
# highlight pixels on mask
self.holo_mask[tuple(zip(*filtered_points))] = (0, 255, 0)
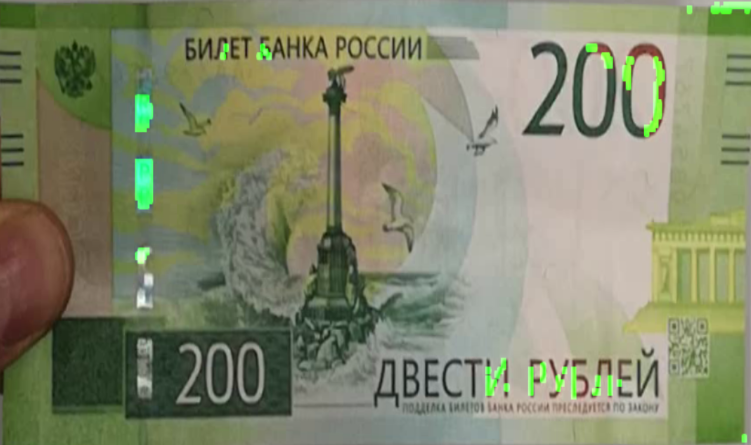
Much better now! Here’s how it looks overlayed on original video:
Two top pieces are highlighted, and the bottom ones, which look more like a foil on this video, aren’t. Another sample with a credit card having a better hologram:
That’s it. See full code on my github. Thanks for reading!